
Linearization
Linearization determines what the output levels of each color need to be in order to produce linear ink coverage at levels ranging from 0 to 100% coverage.
To linearize the color channels:
Calibrate your measurement device:
- Select the type of measuring device and the port that connects it to your computer.
Not all devices support calibration from Color Profiler. If the Calibrate button is disabled, you should calibrate your device using the software provided with it before using it with Color Profiler.
- If desired, click Settings to set advanced settings for the measuring device. Note that only the Setting supported by your device will be available.
| Illuminant | The light source currently used by the device. |
| Observer | The observer angle. |
| Status | The status currently used by your spectrophotometer. |
| If you are unsure which status to use, we recommend using Status A (Automatic). This status will be uniform across all spectrophotometers. | |
| Samples | The number of samples that will be taken of each swatch in a test pattern for automated measuring devices. |
| Spacing | The amount of spacing between the samples, expressed as a percentage of the width of the swatch. This field is disabled when only 1 sample is specified.The approximate position of the specified samples is displayed in the square below. |
- Click Calibrate and follow the on-screen instructions.
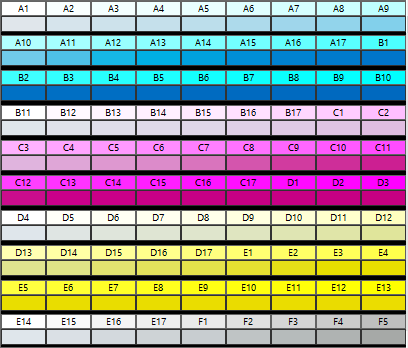
Print and Measure the Linearization Chart
-
Select an Increment size. The smaller the % increment, the larger the number of swatches that will be required in the target.
|
Enhanced
|
Light and dark swatches print in increments of 2%, while the other swatches print in increments of 5%. |
| 5% | Swatches print in increments of 5% |
| 10% | Swatches print in increments of 10% |
- Click Print Target.
- Click the Measure button to measure the swatches with your measuring device.
- After you measure the swatches, check to see that the measured swatches line up with the target swatches.
- If you need to remeasure swatches:
- To remeasure the entire target, click the Measure button.
- To remeasure a swatch sheet, select a swatch and click the Remeasure one sheet button.
- To remeasure a swatch strip, select a swatch in the strip that you want to remeasure and click the Remeasure one strip button.
- To remeasure a single swatch, select the swatch and click Remeasure one swatch button.
Depending on the type of measurement device you use, the choices for remeasuring may be limited.
Check the Linearization curve
To see the linearization curve, do one of the following :
- Double click any measurement swatch.
- Click the Linearization curve button

- The curve should be a relatively smooth arc without any drastic dips, spikes or sections where the curve levels off. An arc containing drastic dips, spikes or level areas is an early indication of measurement errors or improper ink limiting.
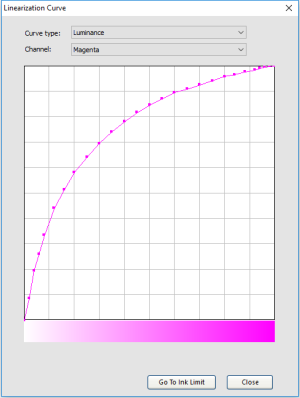
| Curve type | Choose a curve type. | |
| Delta E | This type of linearization curve is best to look at lighter colors, such as yellow. | |
| Luminance | This type of linearization curve is best to look at darker colors, such as black, magenta, cyan | |
| Channel | The color channel for which you want to view the Linearization curve. | |
- Click Next to Continue
The linearization curve flattens or decreases towards the end
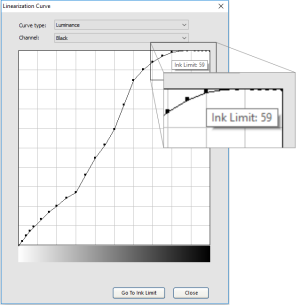
- The reason : Adding more ink does not always result in colors getting darker. There is a point for each printer / ink / media combination where the density of the color stays the same regardless of putting more ink down. For some combinations, putting more ink down actually results in the density dropping.
- To solve this problem :
- Click on the first dot of the linearization curve where it flattens. This will show you what the ink limit setting for that dot would be.
- Return to Single Ink Limits and adjust the value of the channel with this number.
- Continue through the steps and print and measure the linearization chart again.
There is a drop in the middle of the curve
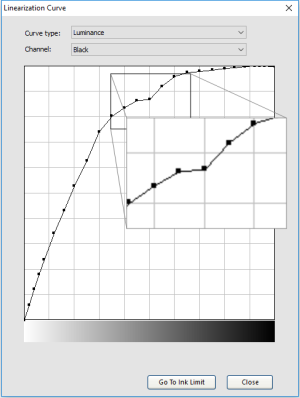
- The most probably reason for this is a bad measurement.
- To solve this problem : measure the linearization chart again. If your spectrophotometer supports it, you can just read this swatch or the strip again.